

See How Components of an Annual Report Drive Business Confidence
 Share
Copy Url
Share
Copy Url
When you break down the components of an annual report, you discover a business story richer than any press release. Those same components of an annual report also guide readers through wins, risks, and next‑year goals. Clear annual report design turns dense tables into friendly visuals, so even a busy reader can see the big picture in seconds. Each financial statement then backs that story with hard numbers. Good corporate communication design ties the words, charts, and images into one smooth flow.
At the same time, corporate reporting must tick more boxes than ever. Boards must share accurate financial data, meet strict reporting standards, and match global reporting frameworks. Doing all three answers the key questions potential investors ask before they write a cheque.
But numbers alone cannot carry the day. Readers also want context—general corporate information that shows how your products, people, and purpose fit together. They want proof of your company’s financial health, not a mystery tour of spreadsheets. A lively tone, clear graphics, and a logical build‑up keep them turning pages instead of clicking away. In short, a smartly built annual report helps you win trust today and unlock fresh opportunities tomorrow.
Why Publish an Annual Report?
Think of a yearly publication that gathers the components of an annual report—stories and numbers—into one trusted source. It blends a friendly company overview, a duly audited financial statement, and forward‑looking insights. Readers get a clear snapshot of results and strategy in a format that travels easily across print and digital channels.
Shareholders scan the income statement. Regulators check compliance. Strategic partners review plans. Employees look for inspiration. The board of directors uses the document to steer policy. Stakeholder engagement rises as each group sees key achievements set out plainly.
Strong corporate reporting fuses narrative with data. It frames financial performance in context and compares performance over the past year with future goals. Transparent financial reporting lets readers understand how the company earns and grows. By refining the components of an annual report, firms unlock trust that attracts fresh capital.
Business Benefits of Publishing an Annual Report
A well‑timed annual report provides more than tables; the components of an annual report pull facts, risks, and vision into one narrative. When a company’s annual report feels like a mini road show, you can email, it sparks interest long before the next quarterly call.
- Investor Confidence Boost—Clear charts of key financial metrics help investors understand returns and risk. Showing these within the components of an annual report signals discipline and lifts share‑buying appetite.
- Regulatory Compliance Made Easy – Mapping disclosures to SASB standards keeps filings smooth and avoids costly restatements. Regulators see a coherent trail; you see fewer follow‑up letters.
- Stronger Brand Reputation – Plain language on strategy and solid corporate governance practices tells the market you play fair, building goodwill that ads alone can’t buy.
- Better Funding Terms – Lenders review your audited numbers to judge your financial position. Transparent data often equals lower interest rates or looser covenants.
- Sharper Strategic Planning – A fresh materiality assessment highlights gaps and wins. Leaders study the insights. They adjust budgets, product bets, and hiring plans.
- Employee Engagement Lift – When milestones and challenges are clear, staff connect their daily work to the company’s performance. This clarity boosts morale and retention.
- Market Differentiation – Sharing rich general corporate information—history, values, innovations—positions you as the expert when prospects compare vendors.
- Risk Management Insight – Spotlighting top threats and related materiality scores helps boards act before issues snowball into losses or lawsuits.
- Sustainability Showcase – Fold ESG metrics into one spread: cite ESG reports, cross‑reference sustainability reports, and note your commitment through “annual reports to their shareholders' sustainability” language. Investors see targets, timelines, and impact.
- M&A Readiness – Clear numbers plus recognised reporting frameworks speed due diligence checks. Buyers grasp synergies quickly and may pay a premium.

Four Core Components of an Annual Report
Smart readers scan the components of an annual report to see a year’s story at a glance—figures, risks, wins, and the road ahead. Built well, this document fuels confident chatter long before the next earnings call and anchors bids from lenders, partners, and buyers.
1. Letter to Stakeholders
A lively Chairman’s letter opens most corporate annual reports. It mixes vision with milestones, then sketches future bets in the CEO’s own words. Savvy writers sprinkle human moments - community work, product firsts, even missteps - to show transparency and accountability. Many cite one or two key metrics that framed strategy, giving the prose a measurable spine.
Why it matters: Investors read tone before totals. A credible voice reassures them the board has a grip on key business realities and won’t dodge hard questions later.
2. Management Discussion & Analysis (MD&A)
The management discussion and analysis section turns dense tables into a narrative. Core elements of a management discussion and analysis include revenue drivers, margin swings, and strategy pivots. Leaders flag key issues: supply shocks, rate hikes, tech shifts, then link each to numbers. Regulators ask if wording lets outsiders see the firm “through management’s eyes.” Deloitte notes that good MD&A explains liquidity needs and capital plans without jargon.
Why it matters: Clear context helps analysts judge whether the company can repeat last year’s highs, not just celebrate them.
3. Financial Statements
Audited facts anchor trust. Pages include the income statement, balance sheet, and cash flow statement, along with notes on accounting policies and an independent auditor’s report. Figures must follow generally accepted accounting principles, letting outsiders compare firms on level ground. Harvard Business School stresses reading all four statements to gauge strength, solvency, and growth.
Why it matters: Lenders, ratings agencies, and buyers price deals from these pages. No other part shows financial muscle so plainly.
4. Corporate Governance & ESG Highlights
This chapter details the board’s organizational structure, oversight processes, and sustainability wins. It lists climate targets, diversity scores, and any third‑party badges earned during the year. Training bodies now offer courses that help directors link ESG to long‑term value, reinforcing good practice at annual meetings and beyond.
Why it matters: Robust governance closes the loop on the components of an annual report, proving that strong earnings ride alongside sound ethics and future‑ready stewardship.

Design Tips for a Compelling Annual Report
Great design turns the otherwise dense components of an annual report into a digital annual report that feels more like a stroll than a slog. Because an annual report is essential for trust and growth, the right layout keeps readers clicking and talking.
1. Use a Clean, Modular Grid
A modular grid lines up photos, tables, and text into clear lanes. These hidden design elements make each spread look ordered on paper and responsive on screen. The pattern also speeds up edits when late changes land.
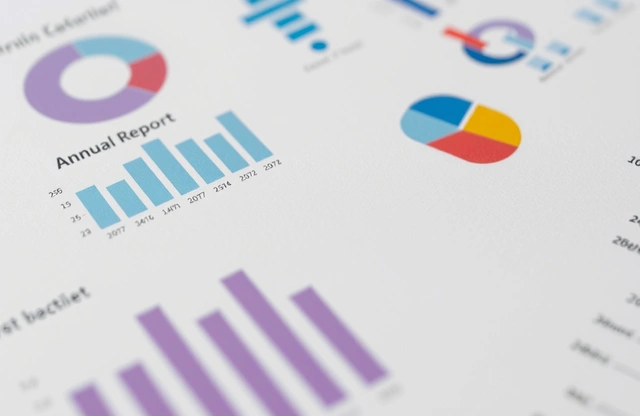
2. Lead with Data Visuals
Readers grasp trends faster when a single chart headlines the page. A report should include one standout KPI per spread, while tables stay in footnotes for detail seekers. Colour‑coded bars or lines highlight change at a glance.
3. Add Story‑Driven Section Breaks
Open each chapter with a punchy stat or stakeholder quote. This small narrative initiative resets attention and signals what matters next. It joins numbers to people and keeps momentum as readers move from strategy to results.
4. Stick to Brand Colours and Fonts
Consistent colours and fonts link every page to your logo. Whether you craft a custom annual report in‑house or hire an annual report design agency, matching palettes tells audiences they are still in the same trusted space.
5 . Balance Text and White Space
Dense paragraphs drain energy. Break blocks into short blurbs, add generous gutters, and let tables breathe. Smart report detailing leaves blank zones that guide eyes and reduce cognitive load, especially in long financial sections.
6. Optimise for Digital First
A company may share its general corporate information with the world through phones first. Tag every heading, add alt‑text to each figure, and run an accessibility check so screen readers can navigate the file with ease.
7. Include Interactive Elements
Readers who rely on annual reports for decisions enjoy clickable graphs, hover‑to‑reveal numbers, or 30‑second clips from report design experts. These touches bring the components of an annual report to life and invite deeper exploration.

Wrap Strategy and Results in High‑Impact Annual Report Design
Smart annual report design packs a full year into one clear story that drives action. Unlike routine quarterly reports or lean half‑yearly reports, the annual edition mixes vision, numbers, and plans in one place. Investors get a single source of truth. Strong visuals keep dense data lively, and research shows this boosts reader trust and recall.
Those visuals must rest on solid facts. When figures follow the International Financial Reporting Standards (IFRS) and other global rules, you show firm alignment with international reporting standards. Regulators and financiers see transparency and accountability.
That polish comes from teamwork. Skilled report designers and content writers shape charts and words so readers glide from headline wins to audited footnotes without friction.
Put together, these pages spotlight strategy, risk, and resilience in language anyone can grasp. They frame past wins and fresh targets in a way that turns curiosity into capital. Stakeholders see a company that plans, measures, and delivers, one they feel confident backing for the long run.
Ready to turn your data into a story that closes deals? Check out our article on annual report design costs and book a discovery session today. Explore how our team can craft your next report and other services that strengthen investor ties. Call us on our toll‑free number 1800 121 5955 (India), WhatsApp us, email contact@reportyak.com, or let us know what you're looking for via the Contact Form on our website.
Related Posts
-
How to Craft a High-Impact Company Annual Report
Feb 27, 2026Share


 Copy Url
Integrated Reporting Made Easy For Modern Companies
Dec 31, 2025Share
Copy Url
How To Adopt BRSR Guidelines For Success
Oct 15, 2025Share
Copy Url