

GRI Sustainability Taxonomy: Learn How to Turn Data Into Advantage
 Share
Copy Url
Share
Copy Url
GRI sustainability taxonomy arrived in June 2025, when the Global Reporting Initiative rolled out a machine‑readable tag set for corporate ESG filings. The launch aims to standardize sustainability data and boost transparency across every report. Until now, even the best GRI taxonomy tools hid inside static PDFs, so analysts copied and pasted each number by hand.
Today’s wave of digital reporting changes that story. Companies can map figures directly using the GRI standards and meet tough new reporting requirements without drowning in spreadsheets. Picture a label maker that clicks onto every metric. Clear tags tighten governance, trim back‑and‑forth with auditors, and plug into the European Sustainability Reporting Standards (ESRS) and the Sustainability Accounting Standards Board (SASB) frameworks.
Investors can now slice sustainability disclosures and compare impacts on people across sectors. Regulators get clean data streams, making it easier to spot hidden risks. Early adopters already enjoy faster assurance cycles, stronger stakeholder engagement, and more time for strategy. They also uncover fresh insights that once stayed buried in footnotes.
We show how the GRI sustainability taxonomy works, highlight the best tools, and outline simple steps that turn ESG reporting from a cost centre into a competitive edge.
What Is the GRI Sustainability Taxonomy?
The GRI sustainability taxonomy is a free, open‑source dictionary of tags that turns every GRI disclosure into structured data. Built on XBRL, it lets companies publish information in a single, searchable file instead of a bulky PDF. This design keeps the GRI ethos public‑minded, so anyone can inspect or improve the code.
Tag Structure—A Closer Look
Think of each GRI sustainability taxonomy tag as a short sentence. Every “sentence” links four tiny building blocks that software can read at lightning speed.
1. Concept – the “what”
This is the precise data point, such as “Scope 1 GHG Emissions.” It sits in the XBRL schema with a unique code, a plain‑language label, and a data type (number, text, yes/no). GRI keeps concepts aligned with its Standards, so one tag always equals one disclosure item.
2. Unit – the “how much”
Units live in a separate list that XBRL calls unitRef. For numbers, you pick kilograms, tonnes, litres, dollars, or kilowatt‑hours. Text facts skip the unit. Locking units this way prevents “apples‑and‑oranges” mix‑ups when analysts compare reports across countries.
3. Dimension – the “in what slice”
Dimensions add context. An axis‑and‑member pair says whether the figure is for 2024, Asia, or the Consumer‑Electronics division. XBRL places these pairs inside the context element next to the entity name and period, so one fact can carry many useful labels.
4. Context – the glue
The context bundle holds the entity ID (usually the company’s LEI), the exact period (year, quarter, or day), and any extra segments like “consolidated” or “parent‑only.” Software uses this bundle to tie every fact back to one moment and one preparer, closing the audit trail.
Why this matters
Match the concept, unit, dimension, and context, and the data turns machine‑readable. It then moves smoothly across the International Sustainability Standards Board (ISSB), Corporate Sustainability Reporting Directive (CSRD), Business Responsibility and Sustainability Reporting (BRSR), BRSR Core, and every other rulebook. Boards spot risks faster, regulators trace ESG disclosures, and investors compare firms without extra mapping. The open‑source model lets users extend tags for local needs, yet still talk to the same global grid. This keeps corporate governance data sharp while cutting data collection work for every existing sustainability team.
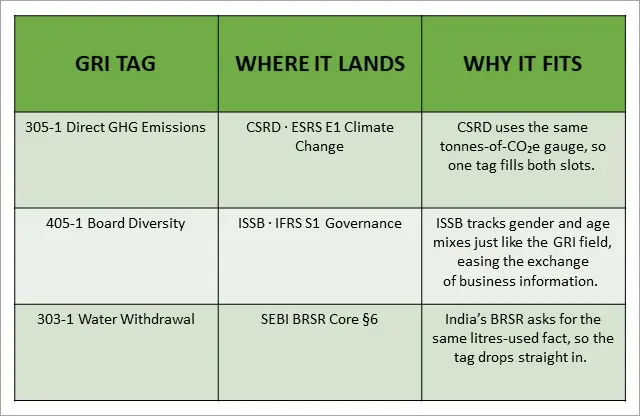
Compatibility with Existing GRI Reports
Reporters do not start from scratch. The taxonomy matches every current GRI standard, tag for tag. Teams lift numbers from their existing sustainability PDFs, then drop them into the new digital shell. It also fits BRSR and BRSR Core, easing ESG disclosures in India and backing India’s growth on the Sustainability Development Index. Because the tags copy the old layout, finance systems spot them immediately. Auditors spend less time hunting links. The file flows to databases that track sustainability in India, EU portals, and any future ESG disclosures hub. In short, the GRI sustainability taxonomy will enable organizations to meet overlapping rules, keep a clean audit trail, and start building a circular economy without costly rework.

Why the New Taxonomy Matters Today
The GRI sustainability taxonomy burst onto the scene on 23 June 2025, when the Global Reporting Initiative switched on an XBRL backbone for its standards.
Each metric now carries a machine‑readable tag, making disclosure swift and letting sustainability information flow as smoothly as financial reporting data. Firms can serve up digital sustainability reporting that is crisp, transparent, and easy to compare. Analysts click once and see figures glide across reporting frameworks with built‑in interoperability. This new taxonomy sets a single, trusted source of truth.
Regulators are moving fast. Europe’s CSRD demands tagged ESG disclosures, and talks aim to align sustainability in India with the same structure.
Meeting fresh regulatory requirements early signals leadership and trims tomorrow’s consultancy bills. Investors cross‑check supply chains, carbon goals, and even circular economy claims in seconds. Boards view real‑time dashboards, while auditors spend fewer hours testing numbers. By acting now, early adopters of the GRI sustainability taxonomy turn compliance into advantage and keep future costs low, while proving that good data drives good business.
Business Value of Machine‑Readable ESG Data
Investors crave numbers they can slice in seconds. The GRI sustainability taxonomy delivers exactly that. Putting sustainability information into a transparent, machine‑readable reporting digital format changes dense PDFs into clear data streams everyone trusts.
1. Instant Investor Insight
Tagged data gives investors instant clarity. The taxonomy layer applied through XBRL stacks each ESG metrics block like easy‑to‑read Lego bricks. Analysts no longer re‑key numbers, so research speeds up and costs drop. Faster insight means smarter trades and more capital for prepared firms today.
2. Effortless Assurance
Auditors love neat rows. Machine‑readable tags enable automated checks that flag gaps seconds after upload. Instead of sampling PDFs by hand, assurance teams run scripts that test each figure against ledgers. Reviews finish days earlier, and the savings show in the next invoice. Everyone gets their weekend back.
3. Slimmer Reporting Spend
For teams still stitching spreadsheets, reporting feels like overtime. Digital sustainability reporting powered by XBRL maps tags once and spits out reports for every regulator. The cut in manual labour slashes vendor bills and frees budget for real impact work, not clerical catch‑up, every quarter, every year.
4. Reputation Lift
Trust sells. When firms share clean, on‑time data, customers, partners, and regulators see them as sustainable. Research shows that key sustainability reporting benefits include easier access to finance and greater employee pride. Digitised tags prove the work behind the claims, so markets reward consistency and punish greenwash less often.
5. Real‑Time Decisions
With tags aligned to ESRS, dashboards refresh once a site uploads numbers. Executives watch carbon curves change daily rather than waiting for quarter‑end packs. Live data lets them fix leaks faster, re‑route capital to high‑yield efficiency, and prove progress before the next board meeting, with hard evidence ready.
6. Seamless Alignment
GRI updates bake the GRI sustainability taxonomy into every tag set, letting firms push one file to regulators, ratings agencies, and industry bodies. The same package feeds various reporting streams, from ISSB pilots to voluntary initiatives. Fewer conversions mean fewer errors and a calmer reporting season for everyone involved.
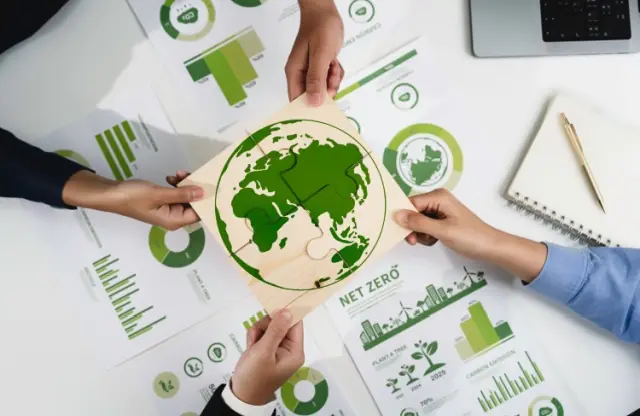
7. Circular Gains
Digitized ESG streams power new analytics that spotlight waste and lost value. Firms targeting a circular economy can trace materials across the chain and model true returns. Insights feed a circular business model, support closed-loop systems, and anchor sustainable business practices that win loyalty and regulatory approval.

Implementation Roadmap for Companies
Moving to the GRI sustainability taxonomy doesn't have to take months. A clear, three‑step sprint can transform your data from messy spreadsheets to transparent sustainability files. Follow this roadmap, and you will please investors, cut costs, and stay ahead of every new rule.
1. Assess Your Data Gap (2–3 weeks)
Gather every KPI you report today and match it against the core tags inside the GRI sustainability taxonomy. Mark the blanks in a simple table. This early scan will ensure clean files later and show auditors you have nothing to hide. Most firms finish the check within ten working days.
2. Map Facts to Tags (3–4 weeks)
Load your gap table into a spreadsheet or an XBRL plug‑in. Link each figure to its tag, unit, and context. The plug‑in turns raw numbers into machine‑readable blocks that regulators can read easily. You still choose what to disclose, yet tagging takes minutes once the mapping sheet is set.
3. Validate, Publish, Promote (2–3 weeks)
Run the file through the online checker. Automatic rules flag any missing links. Fix issues, then submit the final package to the GRI portal or local regulator. Once approved, publish the same file on your site and in your annual report. Stakeholders enjoy integrated ESG reports that update with one click.

Tech Requirements and Integration Tips
Choose smart tools now, and taxonomy will play nicely with every finance screen you own. A light stack means fewer headaches later and faster tags today. Here are the essentials for any GRI sustainability taxonomy journey.
Start with Arelle, a free processor based on XBRL. It validates, views, and exports tags in minutes. The desktop app and API make filings fully digital, so data jumps from spreadsheets to live dashboards without extra code.
Big teams often pick Workiva’s cloud platform. It plugs tagging straight into ERP through secure APIs and stores every file safely in the cloud. Workiva fits the GRI standards into templates you already know. This speeds up sustainability reporting, helps teams meet tight deadlines, and boosts transparency.
Next, add real‑time API calls to SAP or Oracle, then park the output in encrypted object storage. Clean feeds power stakeholder engagement dashboards and track progress toward sustainable development goals. Report Yak turns those numbers into polished stories, keeping the second GRI sustainability taxonomy layer humming quietly in the background.
Aligning with Global Regulations and Investors
Investors and regulators want data they can trust and compare. The GRI sustainability taxonomy meets that need by sliding straight into the world’s biggest rulebooks. Its machine‑readable reporting pipes clean numbers from your system to theirs, cutting review time and raising scores.
Tag files move in XBRL, the global code for exchanging business information. CSRD in Europe, the ISSB’s new IFRS standards, and India’s SEBI BRSR all read that code without tweaks. That reach lifts ESG ratings fast, because data lands clean and early.
By tagging once, companies meet three regimes, cut manual checks, and free teams for advisory work that grows value. Report Yak stands ready, helping organizations slot the second GRI sustainability taxonomy layer into every report, helping them shine in front of global capital.
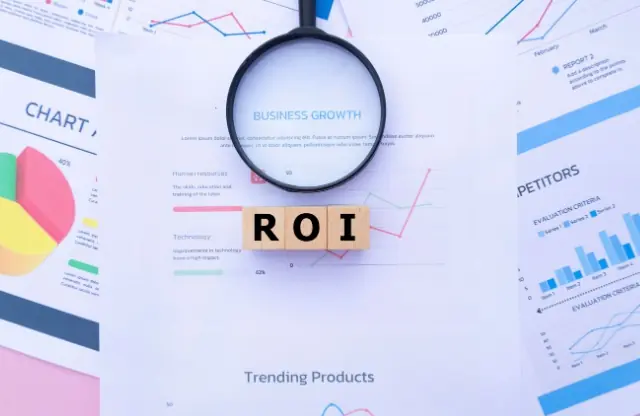
ROI: From Cost Centre to Growth Driver
Switching to the GRI sustainability taxonomy turns static PDFs into a living digital taxonomy that investors can search in seconds. Clear tags save time, slash costs, and lift trust. Below, see how quick wins add up to real money for any reporter.
1. Time Saved per Report
Smart tags fill forms automatically, so teams close a report in eight days instead of twelve. That four‑day gain frees staff to tackle ESG risks and challenges, plan next steps, and still get home on time.
2. Lower Audit Fees
Auditors test data with one click, not one binder. Less manual work cuts their bill by roughly 20 %. The break also lets organizations report sooner, pleasing boards that hate last‑minute surprises.
3. Higher Analyst Coverage
Tagged facts boost comparability across industries. Analysts trust numbers they can sort fast, so coverage widens and questions shift from “where’s the data?” to strategy. Better insight can raise fair‑value targets.
4. Better Capital Access
Clean, early data lowers perceived risk. Studies link sharper ESG signals to cheaper loans and equity, proving that strong tags draw cash. Banks also value the advisory edge you gain from transparent metrics.
Fictional ROI Snapshot
A mid‑cap firm tagged 50 metrics with the second GRI sustainability taxonomy pass. It saved ₹5 lakh in audit fees and freed 160 staff hours, worth another ₹2 lakh. Total gain: ₹7 lakh against ₹3 lakh in setup costs, a 133 % return in one quarter.

Common Pitfalls and Quick Fixes
Even robust reports can stumble when the GRI sustainability taxonomy meets everyday spreadsheets. Studies across a wide range of sectors reveal data slips, unit mix‑ups, and late checks that slow filings. Spot the four most common traps below, then see the swift fixes that keep tags clean, comparable, and easy to analyze.
- Data‑quality gaps – Missing or duplicate facts break links and confuse readers.
Fix: Sync sources weekly; automated scripts flag blanks before export. - Inconsistent units – Mixing kg and lb hides trends and dents trust.
Fix: Lock units in your template; one click converts all figures. - Tag misuse – Choosing the wrong concept tags blurs compliance with GRI standards.
Fix: Use the validator; it lists correct tags and shows why each fits. - Late validation – Errors found after sign‑off force costly rework.
Fix: Run the checker at the draft stage; early tests cut fixes to minutes.
By dodging these slips, the second GRI sustainability taxonomy rollout shines. Clean tags prove that the taxonomy enables fast, machine‑readable reporting and keeps investors smiling.
GRI Compliance - Report Yak Can Help
Great reporting should finish with clear next steps, not another checklist. Report Yak starts every engagement with a lively discovery workshop. Here, we map your story, spot data gaps, and set timelines. Next comes tagging setup—our specialists anchor each KPI to the GRI sustainability taxonomy, then proof it in XBRL so numbers flow digitally to every rulebook. Finally, our designers wrap the data in visually engaging, GRI‑aligned reports that turn pages into proof points.
The pay‑off is real: faster filings, lower audit bills, and richer analyst coverage. Those wins build a sustainable business image and signal ethical business practices long before the next reporting cycle. Waiting means scrambling later as organizations face tighter deadlines and higher fees.
Ready to act? Call our toll‑free line 1800 121 5955 (India), ping us on WhatsApp, or email contact@reportyak.com. You can also drop a note through the Contact Form on our site. Let’s lock your place in the calendar now, turn compliance into capital, and help investors see the value you create; clearly, confidently, and on time.
Related Posts
-
How to Craft a High-Impact Company Annual Report
Feb 27, 2026Share


 Copy Url
Integrated Reporting Made Easy For Modern Companies
Dec 31, 2025Share
Copy Url
How To Adopt BRSR Guidelines For Success
Oct 15, 2025Share
Copy Url